

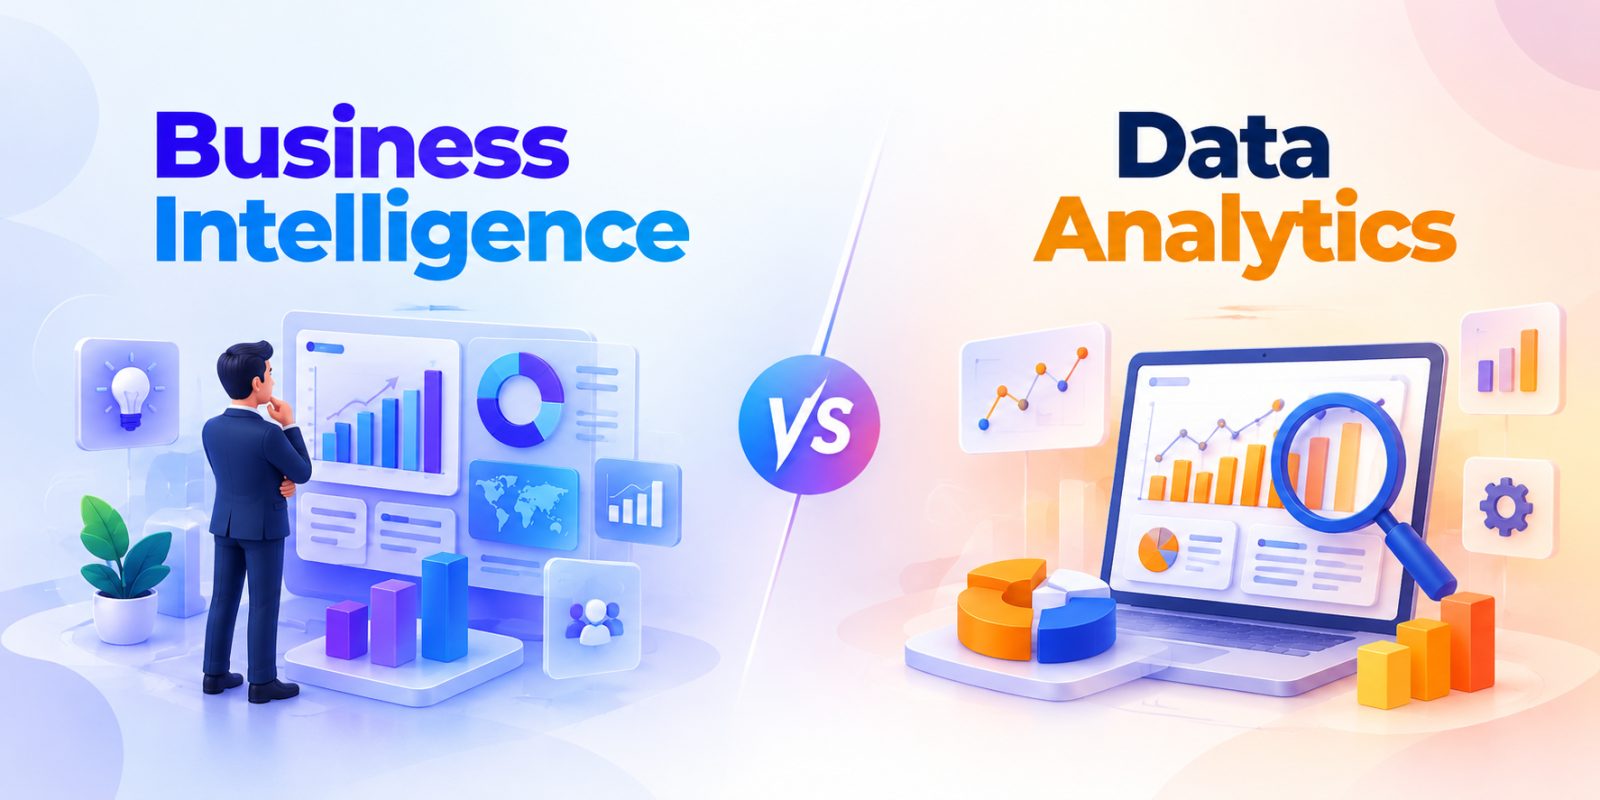
Data Analytics and Business Intelligence help businesses turn raw data into meaningful insights, improve decision-making, and identify opportunities for growth. Although these terms are often used interchangeably, they serve different purposes.
Business Intelligence primarily focuses on understanding historical and current business performance, while Data Analytics examines data to identify patterns, explain outcomes, and predict future possibilities.
In this blog, we’ll discuss the key differences between Data Analytics vs Business Intelligence, their use cases, benefits, and how businesses can choose the right approach.
What Is Data Analytics?
Data Analytics is the process of collecting, cleaning, transforming, and analyzing data to identify patterns, trends, relationships, and actionable insights. It helps businesses understand what happened, why it happened, and what might happen next.
Organizations use Data Analytics to solve specific business problems, evaluate performance, forecast outcomes, and make data-driven decisions. It involves techniques such as statistical analysis, data mining, predictive modeling, and Machine Learning.
Types of Data Analytics
Data Analytics can be divided into four main types based on the questions businesses want to answer and the insights they need.
-
Descriptive Analytics
Descriptive Analytics examines historical data to understand what has happened over a specific period. It uses reports, summaries, and visualizations to highlight trends and performance patterns.
For example, a retail business can analyze monthly sales data to identify its best-selling products and highest-performing locations.
-
Diagnostic Analytics
Diagnostic Analytics investigates why a particular event or result occurred. It compares datasets, examines relationships, and identifies potential factors influencing business performance.
For example, a company experiencing declining sales can analyze customer behavior, pricing changes, and marketing campaigns to identify possible reasons.
-
Predictive Analytics
Predictive Analytics uses historical data, statistical techniques, and Machine Learning models to estimate future outcomes. It helps businesses identify potential opportunities and risks before they occur.
For example, an eCommerce business can forecast customer demand or identify customers who may stop purchasing from the brand.
-
Prescriptive Analytics
Prescriptive Analytics recommends actions based on data, predictions, business constraints, and optimization techniques. It helps organizations evaluate different options and determine which actions may produce better outcomes.
For example, a logistics company can use prescriptive analytics to recommend delivery routes that reduce travel time and transportation costs.
What Is Business Intelligence?
Business Intelligence (BI) refers to the technologies, tools, and processes businesses use to collect, organize, analyze, and present business data. Its primary purpose is to help organizations monitor performance and make informed operational and strategic decisions.
BI commonly uses dashboards, reports, key performance indicators (KPIs), and data visualizations to provide a clear view of business activities. It lets managers and teams track performance, compare results, and identify areas that need attention.
Key Components of Business Intelligence
Business Intelligence combines multiple components to transform data from different sources into useful business information.
-
Data Collection and Integration
BI systems collect information from sources such as CRM platforms, ERP systems, databases, spreadsheets, and business applications. Data integration brings this information together to create a more consistent view of business performance.
-
Data Warehousing
A data warehouse stores structured information collected from different business systems. It provides a centralized environment where organizations can organize historical data and prepare it for reporting and analysis.
-
Reporting and Dashboards
BI dashboards and reports present business information through charts, tables, summaries, and performance indicators. They help users monitor sales, revenue, customer activity, operational efficiency, and other important metrics.
-
KPI Monitoring
Key performance indicators help businesses measure progress toward their goals. BI tools let teams track KPIs over time, compare actual results with targets, and identify areas that need improvement.
Data Analytics vs Business Intelligence: Key Differences
Data Analytics and Business Intelligence both support data-driven decisions, but they differ in approach and primary objectives. BI generally focuses on reporting and monitoring business performance, while data analytics explores deeper relationships, investigates problems, and predicts potential outcomes.
Understanding these differences helps businesses select the right capabilities for their reporting, analysis, and planning requirements.
-
Definition
Data Analytics: Data Analytics involves examining data to identify patterns, understand relationships, answer business questions, and generate insights. It can use statistical analysis, data mining, predictive models, and other techniques to investigate business problems.
Business Intelligence: Business Intelligence focuses on transforming business data into reports, dashboards, and performance metrics. It helps stakeholders understand current and historical results and monitor progress toward organizational goals.
-
Primary Objective
Data Analytics: The main objective of Data Analytics is to extract insights from data and help answer questions about business performance, customer behavior, and future possibilities. Depending on the analytical approach, it can explain outcomes, forecast trends, or recommend actions.
Business Intelligence: The primary objective of BI is to provide a reliable view of business performance. It helps decision-makers monitor KPIs, compare results, identify changes, and make informed decisions using consistent business information.
-
Focus
Data Analytics: Data Analytics focuses on investigating data to uncover trends, relationships, anomalies, and opportunities. It can examine structured and unstructured data to address specific business questions and support more advanced analysis.
Business Intelligence: BI focuses on organizing business information and presenting it in a form that users can easily understand. It emphasizes reporting, performance monitoring, and consistent access to business metrics.
-
Techniques and Methods
Data Analytics: Data Analytics may use statistical modeling, data mining, hypothesis testing, Machine Learning, and predictive analytics. These techniques help analysts explore complex datasets and identify insights that are not immediately visible.
Business Intelligence: BI commonly uses data integration, data warehousing, dashboards, reporting, data visualization, and KPI tracking. These methods help organizations create consistent reports and monitor performance across departments.
-
Data Types
Data Analytics: Data Analytics can work with structured, semi-structured, and unstructured data, depending on the tools and methods used. Sources may include transaction records, customer reviews, website activity, sensor readings, and application logs.
Business Intelligence: Traditional BI systems primarily work with structured, organized business data from databases, data warehouses, spreadsheets, and enterprise applications. Modern BI platforms can also incorporate less structured data when the underlying architecture supports it.
-
Output
Data Analytics: Data Analytics can produce analytical reports, forecasts, statistical models, customer segments, anomaly alerts, and recommendations. These outputs help businesses understand problems and evaluate possible actions.
Business Intelligence: BI typically produces dashboards, recurring reports, visualizations, scorecards, and KPI summaries. These outputs provide stakeholders with a clear overview of business performance.
-
Users
Data Analytics: Data Analytics is commonly used by data analysts, data scientists, business analysts, and specialized teams investigating complex problems. Business users can also benefit from analytics tools that provide accessible insights.
Business Intelligence: BI is widely used by business managers, executives, department heads, and operational teams. Dashboards and reports let users monitor results without needing advanced analytical skills.
-
Decision-Making
Data Analytics: Data Analytics supports descriptive, diagnostic, predictive, and prescriptive decision-making. It helps businesses investigate causes, estimate future outcomes, and evaluate potential strategies.
Business Intelligence: BI primarily supports decisions based on historical and current performance data. It helps stakeholders identify trends, track targets, and assess whether business activities meet expectations.
Data Analytics vs Business Intelligence Comparison Table
|
Factor |
Data Analytics |
Business Intelligence |
|
Main purpose |
Discover insights and investigate business questions |
Monitor and understand business performance |
|
Primary focus |
Patterns, relationships, explanations, and predictions |
Reporting, dashboards, and KPIs |
|
Common techniques |
Statistical analysis, data mining, predictive modeling |
Reporting, visualization, data warehousing |
|
Data types |
Structured and potentially unstructured data |
Primarily organized business data, depending on the platform |
|
Typical outputs |
Forecasts, analytical models, insights, recommendations |
Dashboards, reports, scorecards |
|
Common users |
Analysts, data scientists, business analysts |
Managers, executives, operational teams |
|
Key questions |
Why did it happen? What may happen next? |
What happened? How are we performing? |
|
Business value |
Deeper analysis and forward-looking insights |
Performance visibility and consistent reporting |
Data Analytics vs Business Intelligence: Real-World Examples
Both approaches can be applied to the same business problem, but they may answer different questions. The following examples show how organizations can use them across different industries.
-
Retail and eCommerce
Data Analytics: A retailer can analyze customer purchase history, browsing activity, and seasonal patterns to forecast demand, identify potential customer churn, and improve product recommendations.
Business Intelligence: The same retailer can use dashboards to monitor daily sales, revenue, inventory levels, conversion rates, and store performance across different locations.
-
Healthcare
Data Analytics: Healthcare organizations can analyze patient records and operational data to identify patterns, forecast resource needs, and investigate factors linked to patient outcomes.
Business Intelligence: Healthcare BI dashboards can track patient volumes, appointment utilization, operational costs, and department performance to support resource planning.
-
Banking and Finance
Data Analytics: Financial institutions can use statistical models and Machine Learning to detect unusual transactions, assess credit risk, and forecast customer behavior.
Business Intelligence: BI systems can monitor revenue, loan performance, transaction volumes, customer acquisition, and other financial KPIs through reports and dashboards.
-
Manufacturing
Data Analytics: Manufacturers can analyze sensor readings, production records, and equipment data to identify quality issues, predict maintenance needs, and optimize production processes.
Business Intelligence: BI dashboards can track production output, defect rates, downtime, inventory levels, and delivery performance across manufacturing facilities.
-
Marketing
Data Analytics: Marketing teams can analyze customer journeys, campaign interactions, and conversion patterns to understand audience behavior and predict which campaigns may perform better.
Business Intelligence: Marketing BI dashboards can compare campaign spending, website traffic, leads, conversion rates, and return on advertising spend across channels.
Benefits of Data Analytics
Data Analytics helps organizations move beyond basic reporting by uncovering deeper insights. It supports better planning, deeper customer understanding, and more informed business decisions.
-
Better Decision-Making
Data Analytics provides evidence-based insights that help businesses evaluate different options. It reduces dependence on assumptions and supports decisions based on measurable patterns.
-
Predictive Insights
Predictive models can estimate future demand, customer behavior, and potential operational risks. These insights help businesses prepare for changes and plan resources more effectively.
-
Improved Customer Understanding
Analyzing customer behavior, preferences, and feedback helps businesses understand what influences purchasing decisions. Organizations can use these findings to improve products, services, and customer experiences.
-
Operational Optimization
Data Analytics can identify inefficiencies, recurring problems, and opportunities to improve workflows. Businesses can use these insights to optimize resource allocation and reduce unnecessary costs.
Benefits of Business Intelligence
Business Intelligence helps organizations maintain a consistent view of performance and make information accessible to relevant stakeholders. It simplifies reporting and supports routine operational monitoring.
-
Centralized Business Reporting
BI tools bring information from different business systems into unified reports and dashboards. This helps teams work with consistent metrics instead of relying on disconnected spreadsheets and manual reports.
-
Real-Time or Frequent Performance Monitoring
Depending on the data pipeline and platform configuration, BI dashboards can provide real-time or regularly refreshed performance information. Teams can monitor key KPIs and spot changes faster.
-
Improved Visibility Across Departments
BI helps teams compare performance across departments, locations, products, and business units. This improves transparency and helps stakeholders understand how different activities contribute to organizational goals.
-
Faster Operational Decisions
Clear dashboards and standardized reports help managers identify performance gaps and take corrective action. This is especially useful for routine decisions involving sales, inventory, finance, and operations.
Can Data Analytics and Business Intelligence Work Together?
Yes. Data Analytics and Business Intelligence often work best when used together. BI provides a consistent view of business performance, while Data Analytics helps investigate the reasons behind those results and identify possible future outcomes.
For example, a BI dashboard may show that customer retention has declined over the past quarter. Data Analytics can then examine customer behavior, support interactions, purchase patterns, and product usage to identify possible reasons for the decline.
Teams can incorporate the resulting insights into BI dashboards to monitor retention and evaluate whether corrective actions are working. This combination connects performance monitoring with deeper analysis and continuous improvement.
How to Choose Between Data Analytics and Business Intelligence
The right choice depends on the business questions an organization needs to answer, the maturity of its data infrastructure, and the skills available within its team.
-
Choose Business Intelligence for Reporting
BI is a suitable starting point when a business needs standardized reports, dashboards, KPI monitoring, and a consistent overview of historical and current performance. It is especially useful when multiple teams need access to the same business metrics.
-
Choose Data Analytics for Deeper Insights
Data Analytics helps a business investigate why something happened, identify complex patterns, forecast future outcomes, or evaluate different strategies. It is particularly valuable for problems that require statistical analysis or predictive modeling.
-
Combine Both for Better Results
Businesses that need both performance visibility and deeper insights can combine BI and Data Analytics. BI can track KPIs, while analytics helps explain changes and evaluate possible improvements.
This approach creates a more complete decision-making process, from monitoring performance to identifying opportunities for action.
How BigDataCentric Helps Businesses With Data Analytics and Business Intelligence
BigDataCentric helps businesses turn data into actionable insights through Data Analytics, Data Science, and Business Intelligence solutions. Its services can support organizations that need better reporting, deeper analysis, and more informed decision-making.
-
Data Analytics Solutions
BigDataCentric can help businesses analyze data from multiple sources to identify trends, understand customer behavior, and investigate operational challenges. These insights can support forecasting, performance improvement, and data-driven planning.
-
Business Intelligence and Dashboards
Businesses can use BI dashboards and reports to monitor KPIs, compare results, and access important information in a centralized view. BigDataCentric can help develop business intelligence solutions aligned with specific reporting and operational requirements.
-
Data Integration and Management
Reliable analytics and BI depend on accessible, consistent, and well-organized data. BigDataCentric can help businesses connect data sources and build data workflows that support reporting and analysis.
-
Predictive Analytics and Machine Learning
Businesses looking to move beyond historical reporting can use predictive analytics and Machine Learning to identify patterns and estimate future outcomes. BigDataCentric can develop data-driven solutions tailored to business forecasting and analytical needs.
Conclusion
Data Analytics and Business Intelligence serve related but distinct purposes. Business Intelligence helps organizations monitor performance through dashboards, reports, and KPIs, while Data Analytics explores data to uncover patterns, investigate problems, and predict potential outcomes.
For many businesses, the most effective approach is to combine both capabilities. By using BI for performance visibility and Data Analytics for deeper insights, organizations can make more informed decisions, improve operations, and identify new growth opportunities.










2 thoughts on “Data Analytics vs Business Intelligence: Key Differences, Uses, and Benefits”
Comments are closed.